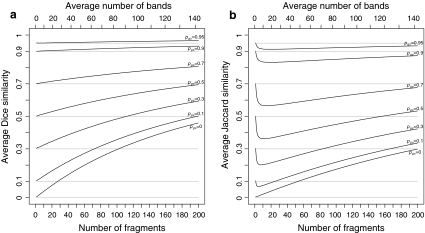
Fig. 1.
a Average Dice, and b average Jaccard similarities as a function of number of fragments for 100,000 simulated pairs of profiles with genetic similarities pgs = 0.0, 0.1, 0.3, 0.5, 0.7, 0.9, 0.95. Fragments are sampled from fld FS with scoring range 51–500. The top axes show the average number of bands on a non-linear scale

