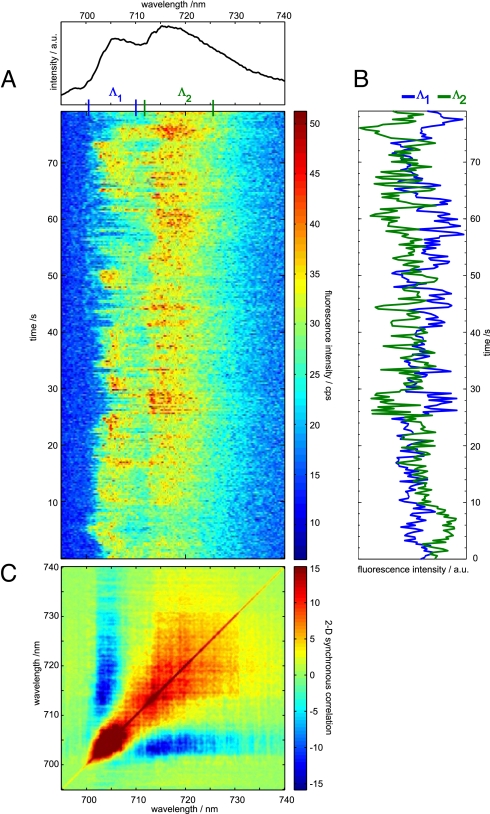
Fig. 2.
Time dependent fluorescence emission from a single PSI complex from Synechocystis sp. PCC 6803. (A) Time series of spectra; the spectrum on top represents the time average. (B) Integrated intensity of the wavelength ranges Λ1 (700.5–710 nm) and Λ2 (712–725.5 nm). The blue line shows the time dependence of the intensity of the ZPL (Λ1) and the green line represents the time dependence of a part of the broad emission (Λ2). (C) Contour plot of the 2D-SCS for the sequence given in A. The color code is indicated on the right; positive values correspond to positive correlation, and negative values correspond to anticorrelation.

