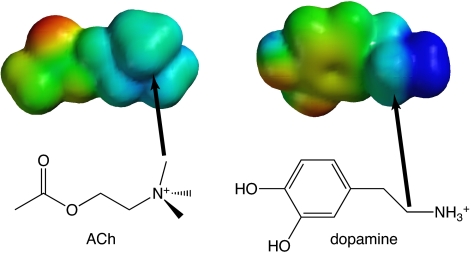
Fig. 5.
Calculated electrostatic potential surfaces (eps) for ACh and dopamine. Color represents relative electrostatic potential, with blue as most positive (limit, +150 kcal/mol), and red as least positive (limit, +13 kcal/mol). Also shown are the structures of each molecule, as well as arrows from a carbon attached to the ammonium N to the corresponding carbon in the eps, showing the similarities in potential.

