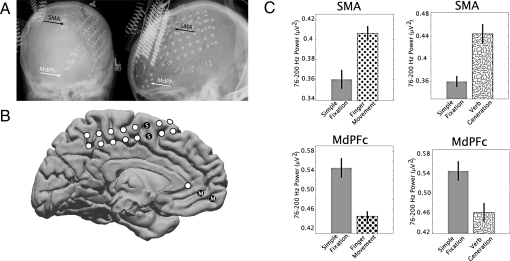
Fig. 1.
Subject 1, areas of high-frequency power increases and decreases. (A) Electrodes covered the medial frontal (interhemispheric) cortex, and the power level between 76 and 200 Hz in the electrocorticography potential was measured from differential electrode pairs. (B) Corresponding locations of electrode pairs in the brain of subject 1 (white and black dots) are shown on a template brain, with coverage of medial prefrontal cortex (MdPFC, “M”) [electrode pair Talairach (35) locations are shown in Table 1] and supplemental motor area (SMA, “S” in black dots). (C) The power at 76–200 Hz is shown for resting fixation (solid gray bars), finger movement (dots), and verb generation (squiggles). Power was higher in the SMA with finger movement but lower in the MdPFC during cued finger movement. Error bars indicate the standard error; all differences were significant (P < 0.01).

