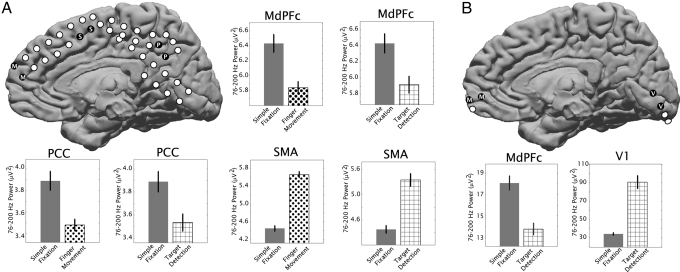
Fig. 2.
Power levels between 76 and 200 Hz in the potential measured from differential electrocorticography electrode pairs in subject 2 (A) and subject 3 (B) are shown for resting fixation (solid gray bars), finger movement (dots), and visual target detection (cross-hatched). Corresponding locations of electrode pairs are shown in schematics, with coverage of MdPFC (“M”) (Talairach locations in Table 1), SMA (“S” in black dots), posterior cingulate/precuneus cortex (PCC, “P”), and primary visual cortex (V1, “V”). Error bars indicate the standard error; all differences were significant (P < 0.01).

