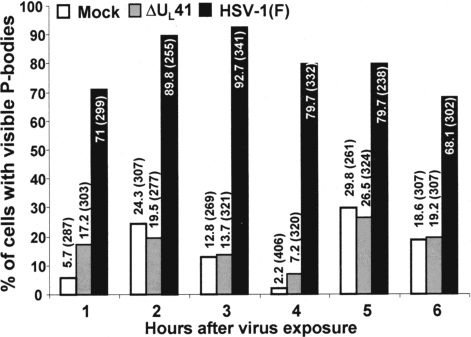
Fig. 2.
Time course of appearance and maintenance of P-bodies in the cytoplasm of uninfected and infected cells. HeLa cells grown in 4-well slides were either mock-infected (white bars) or infected with 20 pfu per cell of HSV-1(F) (black bars), or ΔUL41 mutant virus (gray bars). The cells were fixed and stained at the times indicated. The cells were counted in 10 randomly chosen fields. The percentages of cells exhibiting visible P-bodies were counted and shown as a percentage of total cells counted as indicated in parentheses.

