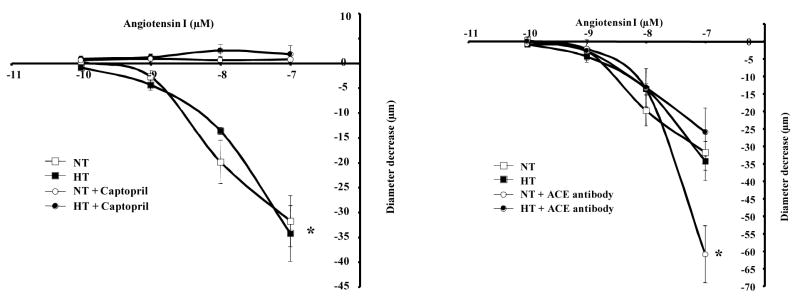
Figure 1.
Left panel: Dose-response to Ang-I (10−10 to 10−7 mol/L) and diameter decrease relationship in normotensive (NT) and hypertensive (HT) mouse mesenteric resistance artery held at 50 mmHg without and with ACE inhibitor (captopril, 10 μM), n=6 per group. *P<0.05, statistically significant, NT vs. NT+captopril; HTN vs. HTN+captopril; Right panel: Dose-response to Ang-I (10−10 to 10−7 mol/L) and diameter decrease relationship in normotensive (NT) and hypertensive (HT) mouse mesenteric resistance artery held at 50 mmHg without and with intraluminal specific ACE antibody (50 ng/ml), n=6 per group. *P<0.05, statistically significant, NT vs. NT+ACE antibody at 10−7 of Ang-I

