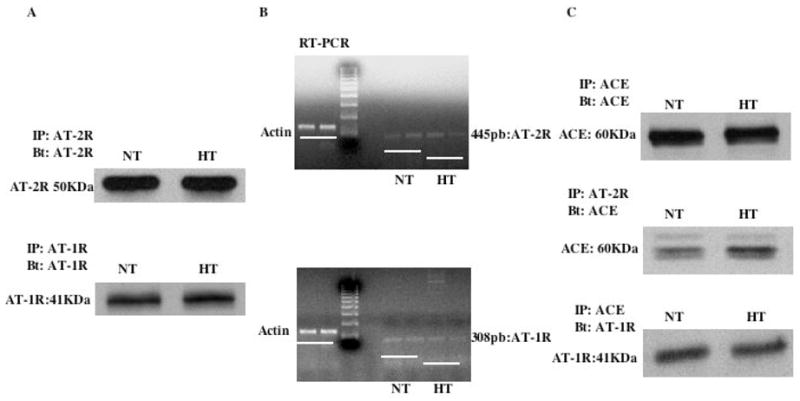
Figure 4.

4A: Western blot analysis showing the presence of AT2R (upper panel) and AT1R (Lower panel) protein expression in normotensive (NT) and hypertensive (HT) mouse resistance arteries; 4B: RT-PCR showing no difference of AT2R (upper panel) and AT1R (Lower panel) mRNA level in resistance arteries from normotensive (NT) and hypertensive (HT) mouse; 4C: immunoprecipitation and western blot analysis showing the presence of ACE in both groups (Upper panel), the interaction between ACE and AT2R (Middle panel) and between ACE and AT1R (Lower panel) in resistance arteries from both groups. n=6 per group.
