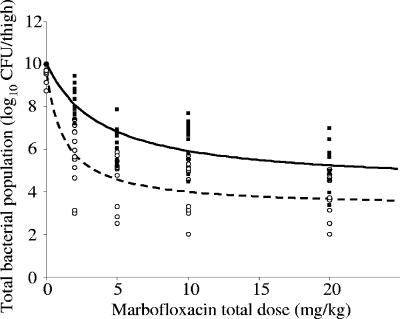
FIG. 2.
Total bacterial population in each thigh infected with a low (○) or a high (▪) inoculum 24 h after different total doses of marbofloxacin. Fitted curves for the dose-effect relationship are shown for the low (dashed line) and high (continuous line) inocula. The bacterial populations were assumed to be 10 log10 CFU/thigh for the dead mice.

