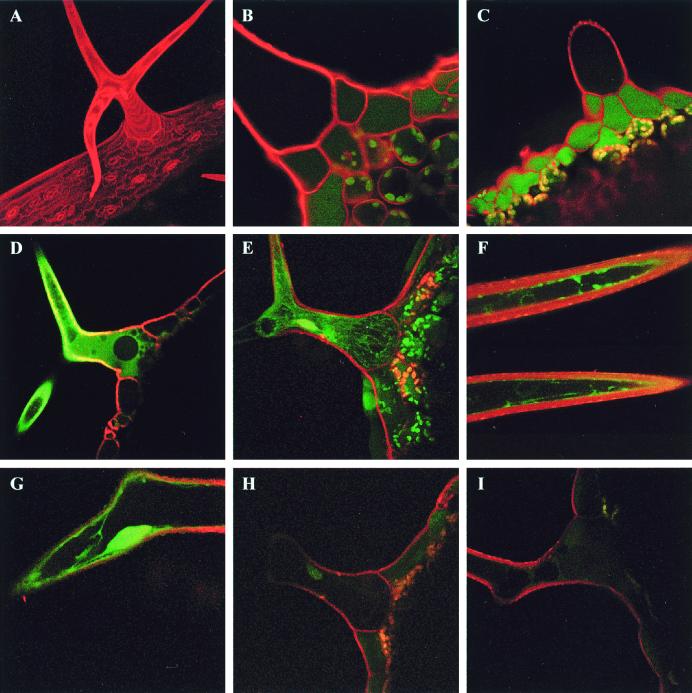
Figure 2.
Measurement of cytoplasmic GSH levels by two-photon laser scanning microscopy. GSH was visualized in intact trichome cells of Arabidopsis after in situ conjugation with MCB to give a fluorescent GSH-bimane conjugate. (A) Maximum projection of 21 optical sections of a leaf trichome stained with 50 μM PI. (B) Single optical section of a leaf trichome labeled with PI showing the low levels of autofluorescence in the trichome itself. (C) Leaf trichome labeled with MCB and PI in the absence of azide. Relatively little labeling is apparent in the trichome because the GSB has been efficiently transported from the cytoplasm into the vacuole, where the massive dilution effectively reduces the concentration to near background levels. (D–G) Representative single optical sections (D, F, and G) or a maximum projection of 20 optical sections (E) of leaf trichomes labeled with MCB and PI in the presence of 5 mM sodium azide to inhibit vacuolar sequestration of the GSB. Fluorescence is visible in the thin peripheral layer of cytoplasm adjacent to the cell wall and in cytoplasmic strands crossing the vacuole. (H and I) Representative images of leaf trichomes from salt-treated plants, labeled with MCB and PI in the presence of 5 mM sodium azide

