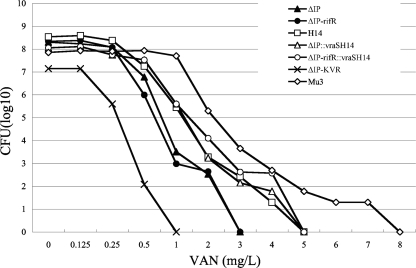
FIG. 2.
Resistant subpopulation profiles of ΔIP, its derivative vraSR mutants, and hVISA Mu3. The numbers of cells (log10 CFU per milliliter) growing on BHI agar containing VAN are shown on the y axis; the VAN concentrations are shown on the x axis. The number of colonies that grew was counted after incubation at 37°C for 48 h.

