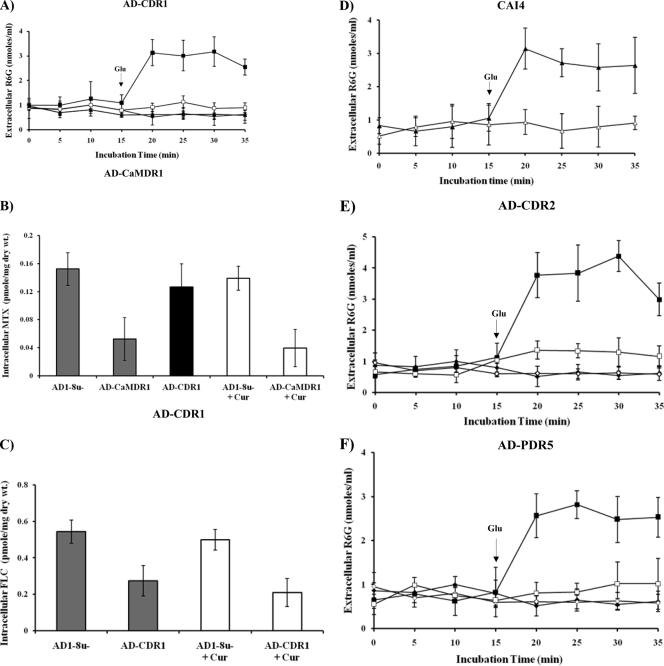
FIG. 1.
Effects of CUR on efflux of substrates in yeast cells. (A) Extracellular R6G concentrations in S. cerevisiae control cells (AD1-8u−) (diamonds) and in cells overexpressing CaCdr1p (AD-CDR1) (squares), incubated either with R6G (10 μM) alone (filled symbols) or with R6G plus CUR (100 μM) (open symbols). Filled triangles represent AD-CaMDR1 cells. Energy-dependent R6G efflux was initiated by adding 2% glucose (arrow) and was quantified by measuring the absorbance of the supernatant at 527 nm. Values are means and standard deviations (error bars) for three independent experiments. (B) [3H]MTX accumulation in S. cerevisiae control cells (AD1-8u−) and in cells overexpressing CaMdr1p (AD-CaMDR1). Cells were incubated either with [3H]MTX (25 μM; specific activity, 8.60 Ci/mmol) alone (shaded bars) or with [3H]MTX plus CUR (100 μM) (open bars). The solid black bar represents AD-CDR1 cells. The accumulated [3H]MTX was measured, 40 min after the initiation of efflux, using a liquid scintillation counter (Beckman). Values are means ± standard deviations (error bars) for three independent experiments. (C) [3H]FLC accumulation in S. cerevisiae control cells and in cells overexpressing CaCdr1p. Cells were incubated with either [3H]FLC (100 nM; specific activity, 19 Ci/mmol) alone (filled bars) or [3H]FLC plus CUR (100 μM) (open bars). The accumulated [3H]FLC was measured 40 min after the addition of glucose (2%). Values are means ± standard deviations (error bars) for three independent experiments. (D) Extracellular R6G concentrations in C. albicans strain CAI4. Cells were incubated either with R6G (10 μM) alone (filled triangles) or with R6G plus CUR (100 μM) (open triangles). Energy-dependent R6G efflux was initiated by adding 2% glucose (arrow) and was quantified by measuring the absorbance of the supernatant at 527 nm. Values are means and standard deviations (error bars) for three independent experiments. (E) Extracellular R6G concentrations in S. cerevisiae control cells (AD1-8u−) (diamonds) and in cells overexpressing CaCdr2p (AD-CDR2) (squares) incubated either with R6G (10 μM) alone (filled symbols) or with R6G plus CUR (100 μM) (open symbols). (F) Extracellular R6G concentrations in S. cerevisiae control cells (AD1-8u−) (diamonds) and in cells overexpressing ScPdr5p (AD-PDR5) (squares), incubated either with R6G (10 μM) alone (filled symbols) or with R6G plus CUR (100 μM) (open symbols). Energy-dependent R6G efflux was initiated by the addition of 2% glucose (arrows) and was quantified by measuring the absorbance of the supernatant at 527 nm. Values are means and standard deviations (error bars) for three independent experiments.

