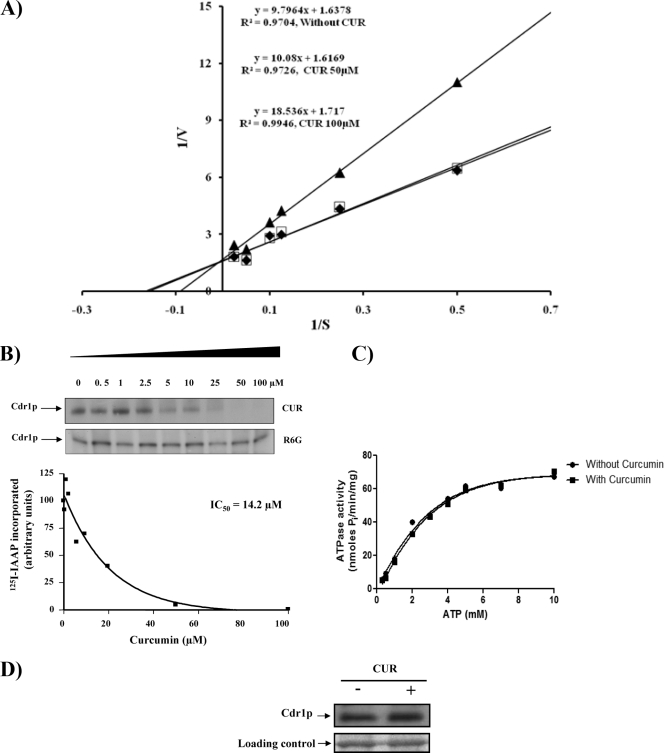
FIG. 4.
Biochemical analysis of CaCdr1p in the presence of CUR. (A) Lineweaver-Burk plot of CaCdr1p-mediated R6G efflux in the presence of CUR 5 min after the addition of 2% glucose. Filled diamonds, open squares, and filled triangles represent 0, 50, and 100 μM CUR, respectively. The rate of each reaction was calculated as nanomoles of R6G released per minute per 5 × 10⁶ cells. (B) Effect of CUR or R6G on the photoaffinity labeling of CaCdr1p with [125I]IAAP. The autoradiogram represents the amounts of [125I]IAAP incorporated into CaCdr1p in the presence of the indicated concentrations of CUR or R6G. The graph represents the amounts of [125I]IAAP incorporated into CaCdr1p in the presence of the indicated concentrations of CUR. (C) Effect of CUR on the ATPase activity of CaCdr1p. PMs from cells overexpressing CaCdr1p were incubated with or without 100 μM CUR and varying concentrations of ATP (0.5 mM to 7 mM) in the ATPase buffer. The assay was performed essentially as described in Materials and Methods. The data are plotted using GraphPad Prism. (D) Effect of CUR (100 μM) on the expression of CaCdr1p. Western blot analyses were performed with an anti-GFP monoclonal antibody. Equal loading of protein was assessed by using a Coomassie-stained gel.

