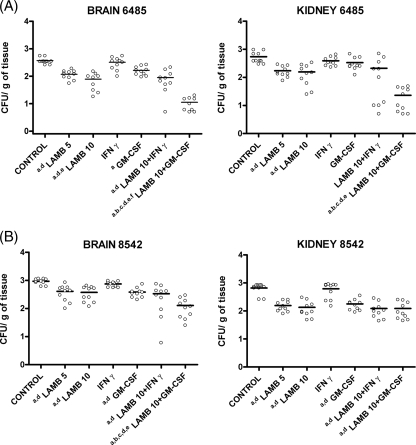
FIG. 2.
Effects of antifungal treatment on colony counts of Rhizopus oryzae strains FMR 6485 (A) and FMR 8542 (B) in brain and kidney tissues of mice. a, P values of <0.002 for comparison with the control; b, P values of <0.002 for comparison with LAMB (5 mg/kg); c, P values of <0.002 for comparison with LAMB (10 mg/kg); d, P values of <0.002 for comparison with IFN-γ (100,000 U); e, P values of <0.002 for comparison with GM-CSF (5 μg/kg); f, P values of <0.002 for comparison with LAMB (10 mg/kg) plus IFN-γ. CFU/g of tissue are expressed as log10 scale. Horizontal lines indicate mean values.

