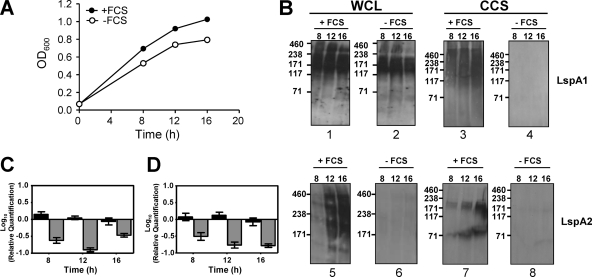
FIG. 2.
Effect of FCS on growth and LspA protein expression. (A) Wild-type H. ducreyi 35000HP cells were grown in CB with FCS (•) and without FCS (○). (B) Western blot-based detection of LspA1 and LspA2 proteins in whole-cell lysates (WCL) and CCS from H. ducreyi 35000HP cells grown in CB with FCS (panels 1, 3, 5, and 7) or without FCS (panels 2, 4, 6, and 8) using the LspA1-specific MAb 40A4 (panels 1 to 4) and the LspA2-specific MAb 1H9 (panels 5 to 8). Molecular mass position markers (in kilodaltons) are present on the left sides of these eight panels. It should be noted that both LspA1 and LspA2 frequently appeared smeared or as multiple bands in Western blot analysis (63). (C and D) Real-time RT-PCR measurement of relative expression levels of lspA1 (▪) and lspA2 (░⃞) in wild-type H. ducreyi 35000HP cells grown in CB−FCS compared to CB+FCS in two separate experiments. Expression of gyrB was used to normalize the amount of cDNA per sample. These two experiments were performed independent of those used to measure protein expression. The bracket bars denote the highest and lowest values.

