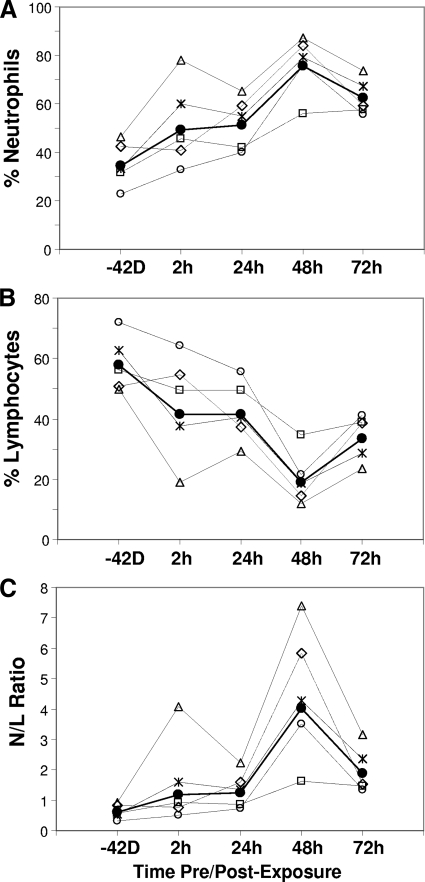
FIG. 3.
Kinetic profile of immune responses in rhesus macaques infected with B. anthracis Ames strain. Percent neutrophils (A), percent lymphocytes (B), and the N/L ratio (C) were plotted over time for the geometric mean and individual values for all five animals. The same symbols are used for panels A, B, and C: animal A, ⋄; animal B, □; animal C, ○; animal D, ▵; animal E, ×; and geometric mean, •. The time points for −42 days (−42D) and 2 h are not to scale.

