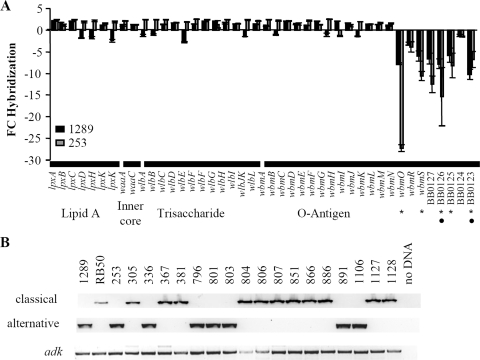
FIG. 3.
CGH and PCR analysis of LPS-related genes in B. bronchiseptica strains. (A) Comparison of LPS-related genes between strains RB50 and 1289 (black bars) or 253 (gray bars) using CGH analysis as described previously (6, 6a). The x axis indicates the gene analyzed and the LPS structure with which it is associated. The y axis indicates the n-fold change in hybridization (FC hybridization) for each gene. Negative n-fold or positive n-fold changes are indicative of decreased or increased hybridization of strain 1289 or 253 genomic DNA compared to results for strain RB50. Error bars represent standard errors. The circles and stars on the x axis indicate genes identified as RDs between strains RB50 and 1289 or 253, respectively. (B) PCR screen for the presence of the classical wbm genes, the alternative wbm genes, and adk in the indicated strains. A sample containing no DNA template was included to ensure the absence of DNA.

