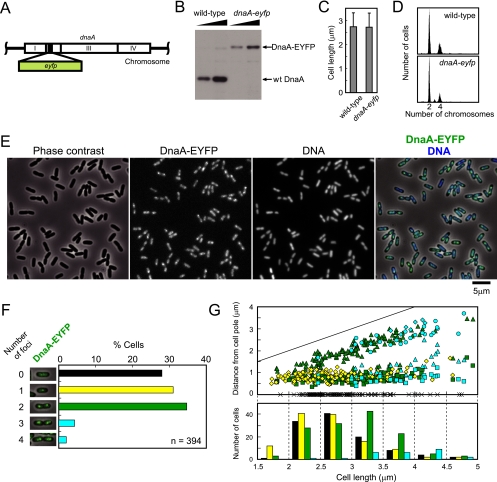
FIG. 1.
dnaA-eyfp strain. (A) Replacement of a portion of the domain II-encoding region of chromosomal dnaA by eyfp. (B) Immunoblotting using an antibody specific for DnaA. (C) Cell length distribution measured by microscopy. Three hundred cells were selected at random. Averages are shown with standard deviations. (D) Fluorescence histograms of DNA after replication runout. (E) Localization and focus formation of DnaA-EYFP at the nucleoid. In the merged picture at the far right, DnaA-EYFP and DNA are shown in green and blue, respectively. (F) Quantification of cells bearing each number of the DnaA-EYFP foci. Pictures of representative cells are presented. (G) Cellular positions of DnaA-EYFP foci. Positions of the foci scored in panel F were measured from a pole of each cell and plotted against the cell length. Cells with no focus are plotted as crosses on the abscissa. Colors of symbols represent cellular focus number as shown in panel F. In cells with two or more foci, the first, the second, the third, and the fourth focus from a cell pole are shown by a square, a triangle, a circle, and a diamond, respectively. The straight line indicates cell length. The lower panel shows the distribution of cells with each focus number in seven cell size classes. Focus numbers are represented by colors.

