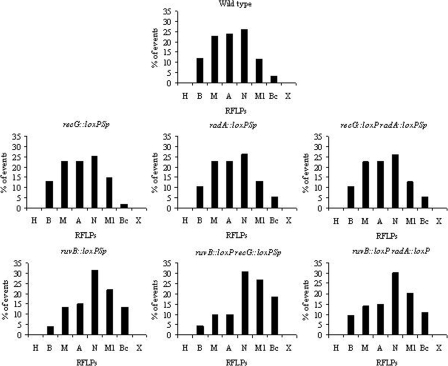
FIG. 4.
Distribution of converted sites in continuous gene conversion tracts in the wild-type and HJ mutant strains. For each panel, the percentage of events in which the corresponding site appears converted (either for gain or for loss) in the indicated strain is shown. Data are derived from Fig. S1 in the supplemental material (excluding discontinuous events). For clarity, data are presented as percentages, although the statistical analysis presented in the text was done using the actual values. Capital letters on the x axis represent each RFLP introduced along the nifH gene, oriented from the 5′ end to the 3′ end of nifH. H, HindIII; B, BamHI; M, MaeIII; A, ApaLI; N, NarI; Ml, MluI; Bc, BclI; X, XbaI.

