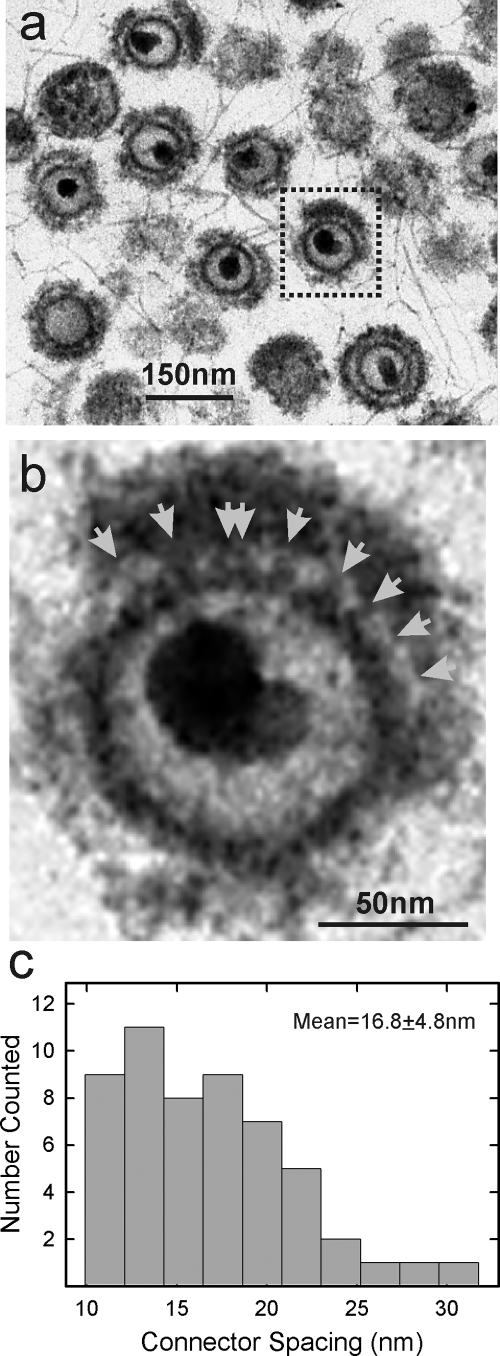
FIG. 5.
Electron microscopic analysis of TEV exhibiting connections between the capsid and the tegument. A representative image of a TEV with connectors is shown at low (a; boxed image) and high (b) magnifications. Connectors are indicated by arrows in panel b. The spacing between connectors was measured in 13 TEV images, and the results are shown in panel c.

