FIG. 2.
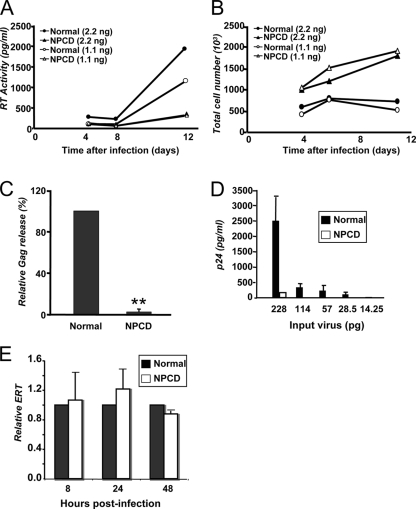
HIV-1 replication is suppressed in NPCD lymphoblasts. (A) Normal lymphoblasts (circles) and NPCD lymphoblasts (triangles) were infected with either 2.2 ng (filled) or 1.1 ng (open) of HIV8X. At 4, 6, and 11 days postinfection, RT activity in the supernatant was measured. The results shown are the means of five independent experiments. (B) Total cell number was determined for each of the infected cell populations represented in panel A at the same time points after infection. The results shown are the mean of five independent experiments. (C) Normal and NPCD lymphoblasts were infected with 2.2 ng of HIV8X. At 30 days postinfection, the amount of Gag released into the supernatant was measured by a standard p24 ELISA. The relative amounts of Gag are the percentage of normal cells infected with the same amount of virus (arbitrarily set as 100%). The results shown represent the mean ± standard deviation from three independent experiments. **, P < 0.001, compared to infected normal lymphoblasts. (D) Normal (black bars) and NPCD (white bars) lymphoblasts were infected with 2.2 ng of HIV8X. At 15 days postinfection, virus-containing supernatants were collected and purified. Virus produced from each cell type was normalized by p24, and comparable amounts were used to infect Jurkat cells. The amount of Gag released by the Jurkat cells into the supernatant was measured by a standard p24 ELISA. The results shown represent the mean ± SD from three independent experiments. (E) Relative levels of HIV-1ERT were quantified by real-time PCR in HIV8X-infected normal (black bars) and NPCD (white bars) lymphoblast cells at the indicated time points. The relative ERT is normalized to normal cells (arbitrarily set as 1). The results shown represent the mean ± standard deviation from three independent experiments.

