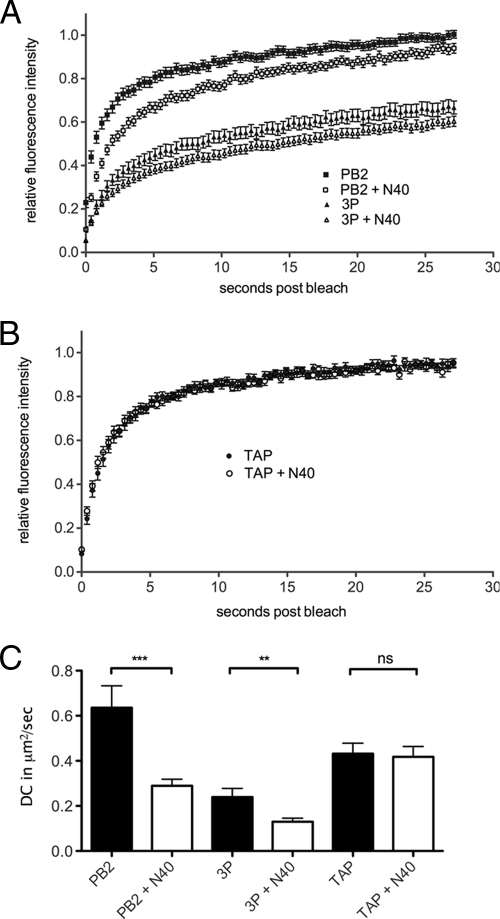
FIG. 5.
FRAP analysis of N40. 293T cells were transfected with plasmids encoding PB2-GFP or PB1-GFP, PA, and PB2 (3P) (A) or GFP-TAP (B) in combination with either N40 or an equivalent amount of empty vector, and the dynamics of the GFP-tagged proteins were examined by FRAP. Average (means ± the SEM) recovery curves from at least 32 individual cells are plotted in panel A and from at least 20 cells are plotted in panel B. (C) Mean plus SEM DC values are plotted. **, P < 0.01; ***, P < 0.001.

