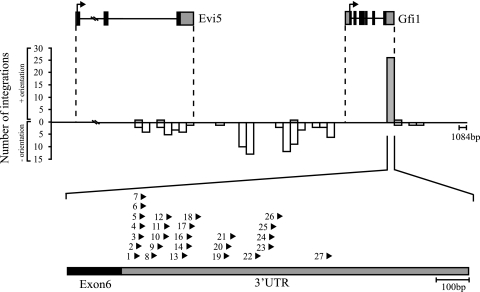
FIG. 1.
MLV integrations identified in the genomic region carrying Gfi1 and Evi5. Gfi1 and Evi5 gene structures are shown at the top with coding sequences (black) and UTRs (gray). The transcriptional direction of the genes is indicated by arrows. The number of integrations is indicated by bars. Gray bars represent retroviral integrations in the same transcriptional orientation; white bars represent integrations in the opposite transcriptional direction. Each bar represents 1,084 nucleotides, corresponding to the size of the Gfi1 3′UTR. Integrations in the Gfi1 3′UTR are shown below the graph. The position and transcriptional orientation of the provirus are indicated by arrowheads.

