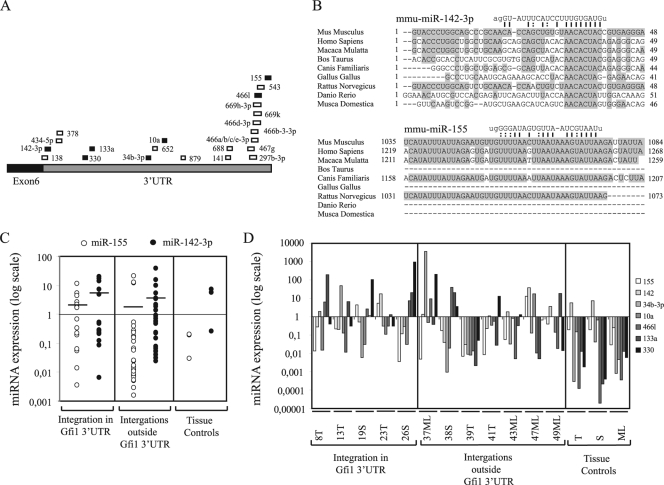
FIG. 4.
(A) Predicted miRNA binding sites in the Gfi1 3′UTR from miRNA registries (http://microrna.sanger.ac.uk and http://microrna.org, April 2009). Positions of the different miRNA binding sites in the Gfi1 3′UTR are indicated by boxes, and miRNAs are indicated by numbers. miRNAs indicated by black boxes were selected for expression analysis. (B) Alignment of miR-142-3p and miR-155 binding sites in different species. Conserved nucleotides are boxed. Presumed binding sites and nucleotide sequences for miR-142-3p and miR-155 are shown, and complementary nucleotides are connected by lines. G·U base pairing is indicated by dashed lines. (C) miR-142-3p and miR-155 expression in 43 tumors with integrations in the Gfi1 3′UTR and outside the Gfi1 gene and three control tissue, i.e., thymus (T), spleen (S), and mesenteric lymph node (ML), assayed by TaqMan real-time PCR. The data were calculated by the ΔCT method, and the values were normalized to snoRNA420. Thymic, splenic, and mesenteric lymph node tumors were further normalized to thymus, spleen, and mesenteric lymph node tissue controls, respectively. Expression for tissue controls is shown as normalized to snoRNA420. Lines indicate mean values for miR-142-3p and miR-155 expression. (D) Real-time PCR expression analysis for miR-155, miR-142, miR-34b-3p, miR-10a, miR-466l, miR-133a, and miR-330 on 12 tumors with integrations in the Gfi1 3′UTR and elsewhere in the gfi1 locus and three control tissues, i.e., thymus (T), spleen (S), and mesenteric lymph node (ML). The data were processed as described above.

