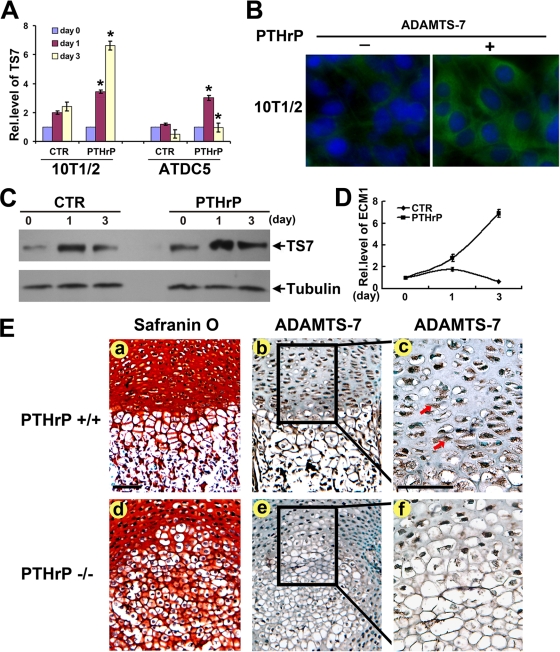
FIG. 7.
ADAMTS-7 expression depends on PTHrP signaling. (A) PTHrP induces the expression of ADAMTS-7 mRNA, assayed by real-time PCR. 10T1/2 and ATDC5 cells pretreated with recombinant 300 ng/ml of BMP-2 for 1 week were cultured without PTHrP (CTR) or with PTHrP (10−7 M) for various time periods, as indicated. The normalized values against GAPDH were calibrated against controls (day 0), given the value of 1. Asterisk indicates a significant difference from the control at corresponding time points (P < 0.05). (B) PTHrP increases the level of ADAMTS-7 protein, assayed by immunofluorescent cell staining. Micromass cultures of C3H10T1/2 cells treated with or without PTHrP (10−7 M) for 3 days were stained with anti-ADAMTS-7 antibodies (green). The nuclei were stained with 4′,6-diamidino-2-phenylindole (DAPI). (C) PTHrP induces the expression of ADAMTS-7 protein, assayed by Western blotting. ATDC5 cells pretreated with recombinant 300 ng/ml of BMP-2 for 1 week were cultured without PTHrP (CTR) or with PTHrP (10−7 M) for various time periods, as indicated. The cell lysates were detected with either anti-ADAMTS-7 or antitubulin (serving as an internal control) antibodies. (D) PTHrP induces the expression of ECM1 mRNA, assayed by real-time PCR. 10T1/2 cells pretreated with recombinant 300 ng/ml of BMP-2 for 1 week were cultured without PTHrP (CTR) or with PTHrP (10−7 M) for various time periods, as indicated. The normalized values against GAPDH were calibrated against controls (day 0), given the value of 1. (E) ADAMTS-7 is markedly reduced in the growth plate chondrocytes of PTHrP null mice, revealed by immunohistochemistry. Safranin O staining was performed using sections of long bone from 18.5-day-old wild-type (a) and PTHrP null mutant (d) mouse embryos. (b and e) Low-power microphotograph of section stained with anti-ADAMTS-7 antibodies (brown, indicated with arrows) and counterstained with methyl green (green). (c and f) High-power microphotograph of the section shown in panels b and e. Rel.level, relative level. Bar = 100 μm.

