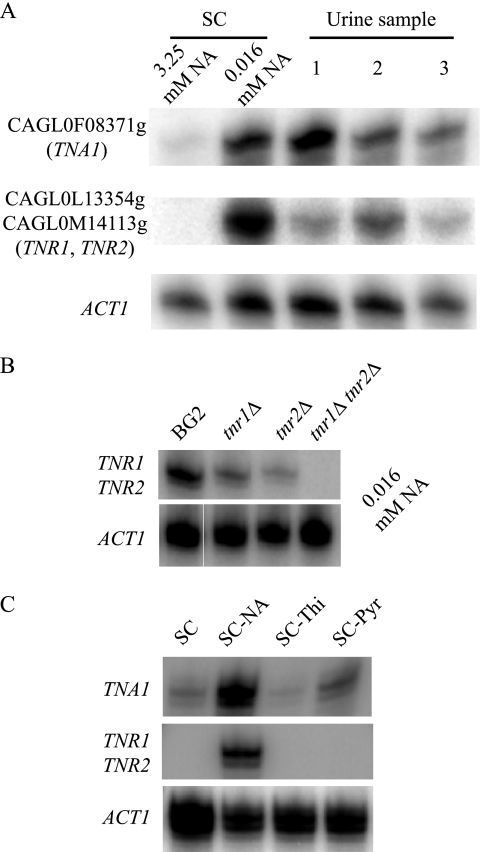
FIG. 1.
TNA1, TNR1, and TNR2 are transcriptionally induced by niacin limitation. (A) S1 nuclease analysis of TNA1, TNR1/TNR2, and ACT1 transcript levels. RNA prepared from strain BG2 growing in SC medium containing 3.25 μM or 16 nM NA or in three different urine samples. The OD600 of all cultures was 0.5. (B) S1 nuclease analysis of TNA1 and TNR1/TNR2 transcript levels of the BG2, tnr1 mutant (BG1338), tnr2 mutant (BG1335), and tnr1 tnr2 mutant (BG1337) strains. Strains were grown in SC medium containing16 nM NA. The OD600 of all cultures was 0.5. (C) S1 nuclease analysis of TNA1 and TNR1/TNR2 transcript levels of strain BG2 growing in SC medium with limiting amounts of niacin (SC-NA, 16 nM), thiamine (SC-Thi, 6 nM), or pyridoxine (SC-Pyr, 0.19 nM). At these vitamin levels, the terminal OD600 of all of the cultures was 1.5.

