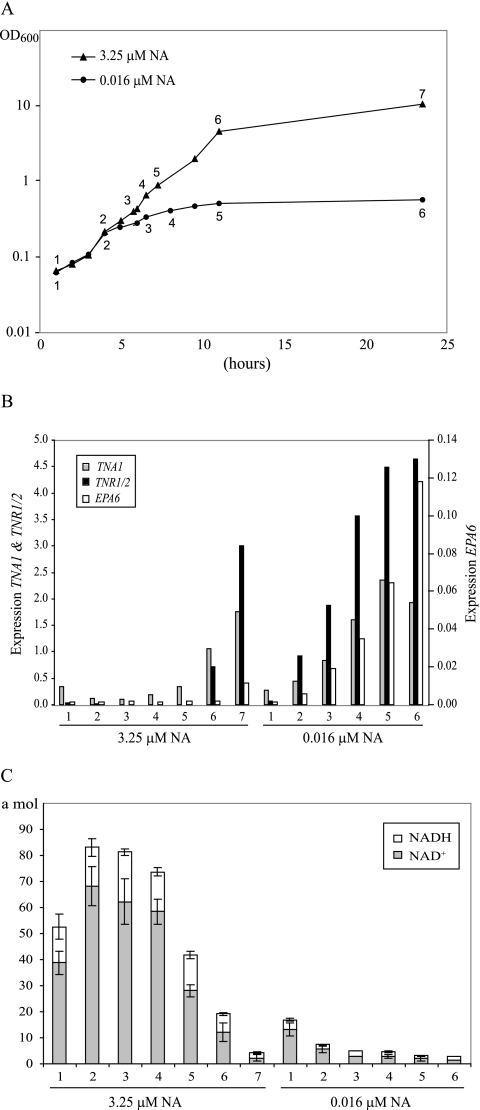
FIG. 6.
Analysis of C. glabrata grown in SC medium containing 3.25 or 0.016 μM NA. (A) The values are time points for the collection of cells used in quantitative reverse transcription-PCR and for analysis of intracellular NAD+ and NADH concentrations. (B) Quantitative reverse transcription-PCR analysis of TNA1, TNR1/2, and EPA6 transcript levels. RNA was prepared from wild-type C. glabrata grown in SC medium containing 3.25 or 0.016 μM NA. The indicated time points correspond to those in panel A. The transcript levels of TNR1/TNR2, TNA1, and EPA6 were normalized to levels of HHT2, a gene with constant expression levels under normal and low-NA conditions based on our microarray analysis. (C) Intracellular NAD+ and NADH concentrations. Cells grown in SC medium containing 0.016 μM NA have very low levels of intracellular NAD+ and NADH compared with those of cells grown in SC containing 3.25 μM NA. Error bars represent the standard error of the mean.

