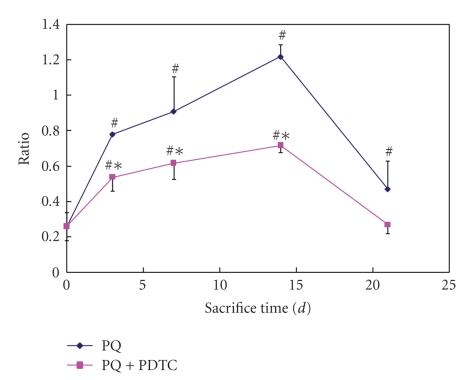
Figure 4.
Expression TGF-β1 mRNA in lung tissue from groups of the control, PQ treatment, and PQ+PDTC treatment. Relative TGF-β1 mRNA abundance was normalized with the β-actin, and expressed as relative units. Values are given as mean ± SE (n = 3). # Compared with the control, P < .05; *compared with the PQ treatment, P < .05.

