
Figure 3.
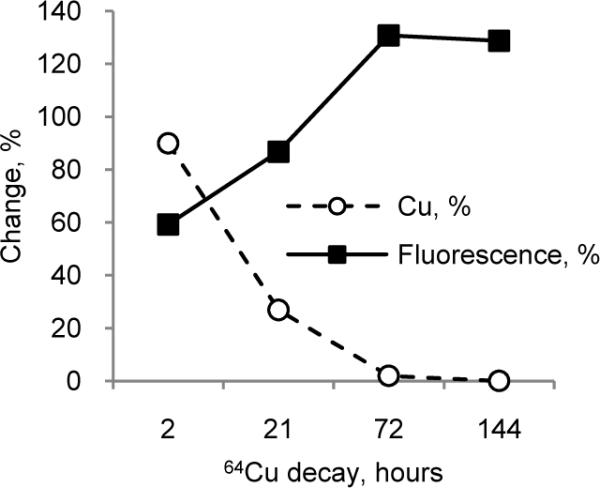
Change in 64Cu2+ (%) concentration as a result of decay (calculated from exponential decay) and change in relative fluorescence of Cu-LS479 (%) solution as a function of time. Unquenched LS479 (0.5 μ-M) corresponded to a hypothetical time-zero point (F0t) for fluorescence. Relative fluorescence was measured as an area under the emission curve after addition of 64Cu solution divided by the area before the addition (ex. 675 nm). An overall increase in fluorescence intensity was seen as a function of time.