Figure 4.
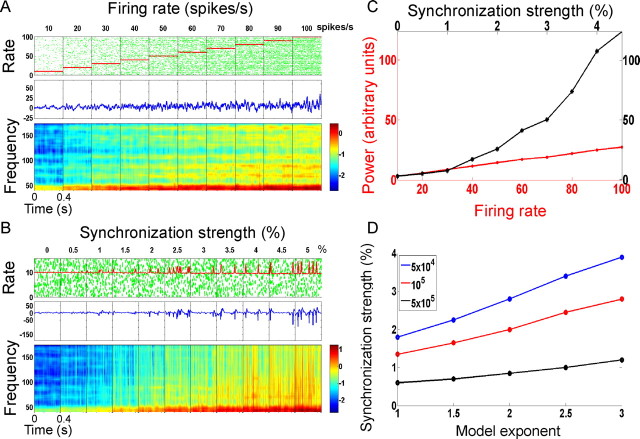
ECoG modeling results. For plots A–C, the total number of neurons is 105 and the model exponent (n in Eq. 2) is 2. A, Top row shows example raster plots of simulated spike trains with random firing (a representative set of 50 spike trains is shown). The 10 panels correspond to 10 different simulations for which the firing rate was fixed between 10 and 100 spikes/s. The numbers on top of the panel indicate the theoretical firing rate in spikes/s. The instantaneous firing rate (computed from the rasters) is shown in red. The middle row shows the simulated ECoG signal for each simulation. The bottom row shows the time-frequency power spectrum (in dB) of the ECoG (50 simulations like the one shown in the top were averaged, consistent with the number of trials averaged in LFP data and a previous ECoG study). B, Same panel configuration as in A; the simulated spike trains all have a mean fixed firing rate of 10 spikes/s, but a subpopulation of the neurons fire in synchrony. The percentage of synchronously firing neurons increase from 0 to 5% from left to right (indicated by the numbers on top of the panel). C, High-gamma power (60–150 Hz) for the simulations with increasing firing rate (red) and increasing synchronization (black). D, The synchronization strength required to match the high-gamma power of a randomly firing population with a firing rate of 100 spikes/s, for different values of N (size of the neural population; colored lines as labeled in legend) as a function of the model exponent.

