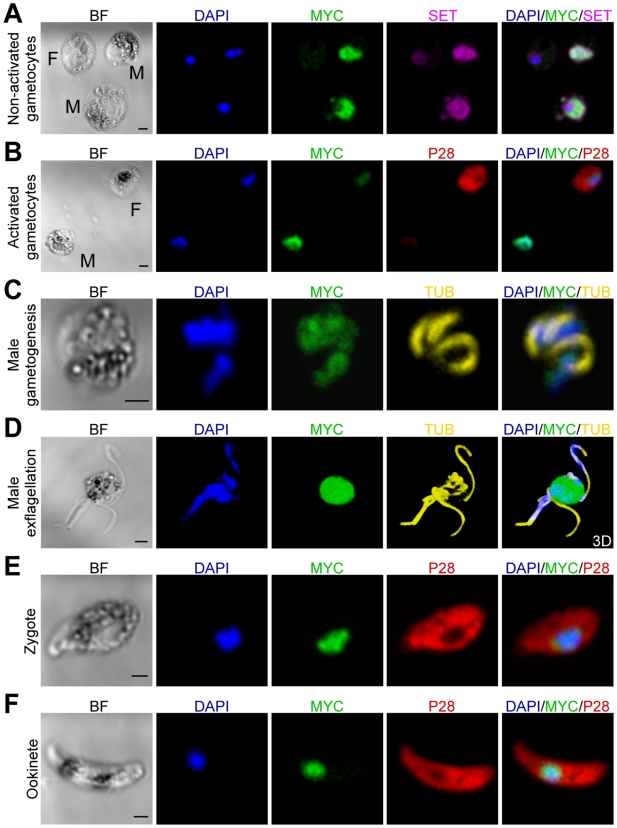
Figure 3. MISFIT protein expression, localization and distribution.
(A–F) Immunofluoresence images from confocal sections of fixed pbmisfit-myc parasite stages. Images show DAPI staining of DNA in blue and the following antibody stainings: anti-MYC of MISFIT-MYC protein in green, anti-SET in violet, anti-P28 in red, and anti-Tubulin (TUB) in yellow. Fluorescent images of the exflagellating male gametocyte (D) are 3D reconstruction of a confocal stack after deconvolution. Scale bars in bright field (BF) images correspond to 2 µm. M, Male; F, Female.

