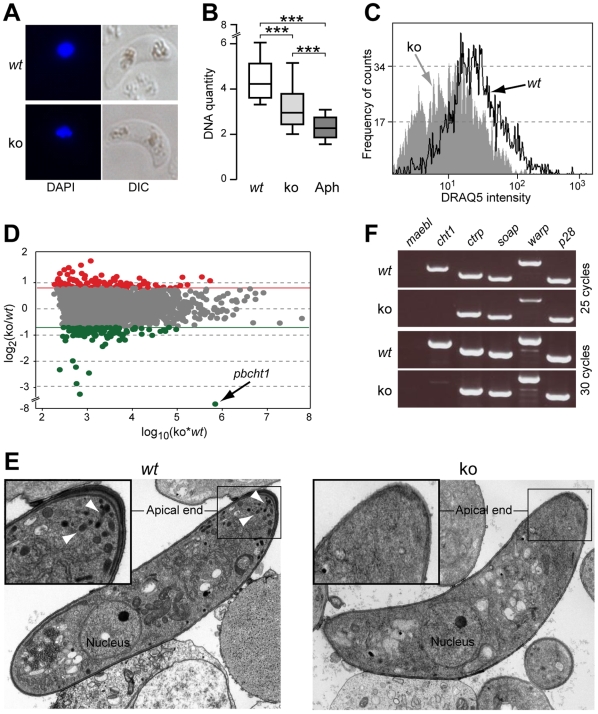
Figure 5. Misfit ko ookinetes show less DNA, altered transcriptome and defective micronemes compared to wt.
(A) Microscopy images of wt and misfit ko ookinetes stained with DAPI. (B) Box plots showing DNA quantity levels of wt, misfit ko and aphidicolin-treated (Aph) ookinetes. DNA quantity is determined by the ratio of ookinete to asexual blood stage (haploid) measurements of DAPI-staining intensities. Boxes are divided by the arithmetic mean to upper and lower quartiles, respectively. Upper and lower whiskers indicate distribution ranges. Results from ANOVA t-test comparisons are shown (***, P<0.001). (C) Analysis of fluorescence intensities by flow cytometry of wt and misfit ko ookinetes stained with the DNA-intercalating dye DRAQ5. (D) Microarray Ratio-Intensity (R-I) plot showing differential gene expression measurements between control wt and misfit ko ookinetes. Measured intensities are plotted as a function of the logarithm of their product. Red and green dots represent genes that are up or downregulated by at least 1.7 fold, respectively, in misfit ko compared to wt ookinetes. Grey dots represent genes that do not show significant regulation. (E) Transmission electron micrographs (TEM) of wt (left panel) and misfit ko (right panel) ookinetes. Insets show magnifications of the ookinete apical ends, depicting the severe microneme reduction in misfit ko compared to wt. Normal wt micronemes are indicated with white arrowheads. (F) RT-PCR of genes encoding known micronemal proteins. PCR reactions were performed at 25 and 30 cycles, respectively, to highlight expression differences. Maebl encodes a micronemal protein of sporozoites and merozoites, but not of ookinetes, and was used as a negative control. The ookinete-expressed p28 does not encode a micronemal protein and was also used as a control.

