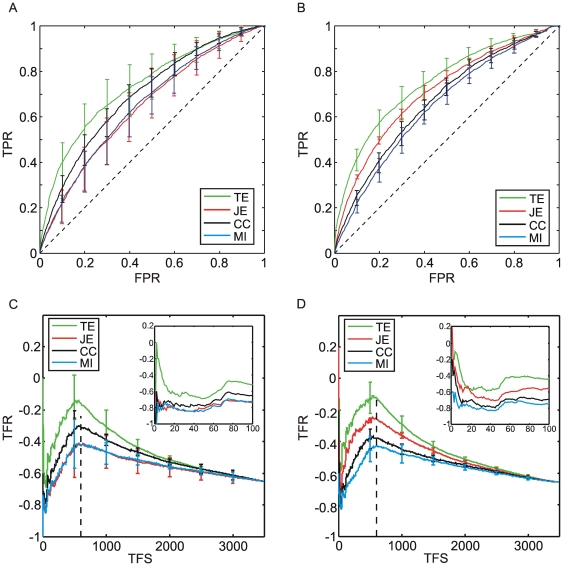
Figure 4. ROC and PPC curves relative to the presented connectivity methods.
(A) ROC curves relative to the completely excitatory network models. (B) ROC curves relative to the network models where the connections are both excitatory and inhibitory. Black, blue, red, and green lines indicate CC, MI, JE and TE, respectively. The diagonal (dashed) line (A–B) corresponds to the random detection. (C) PPC evaluated on the E network models. (D) PPC evaluated on the EI network models. The insets (C–D) show a zoom of the first 100 TFS. The vertical dashed line (C–D) identifies the number of the excitatory elements present in the SWM.

