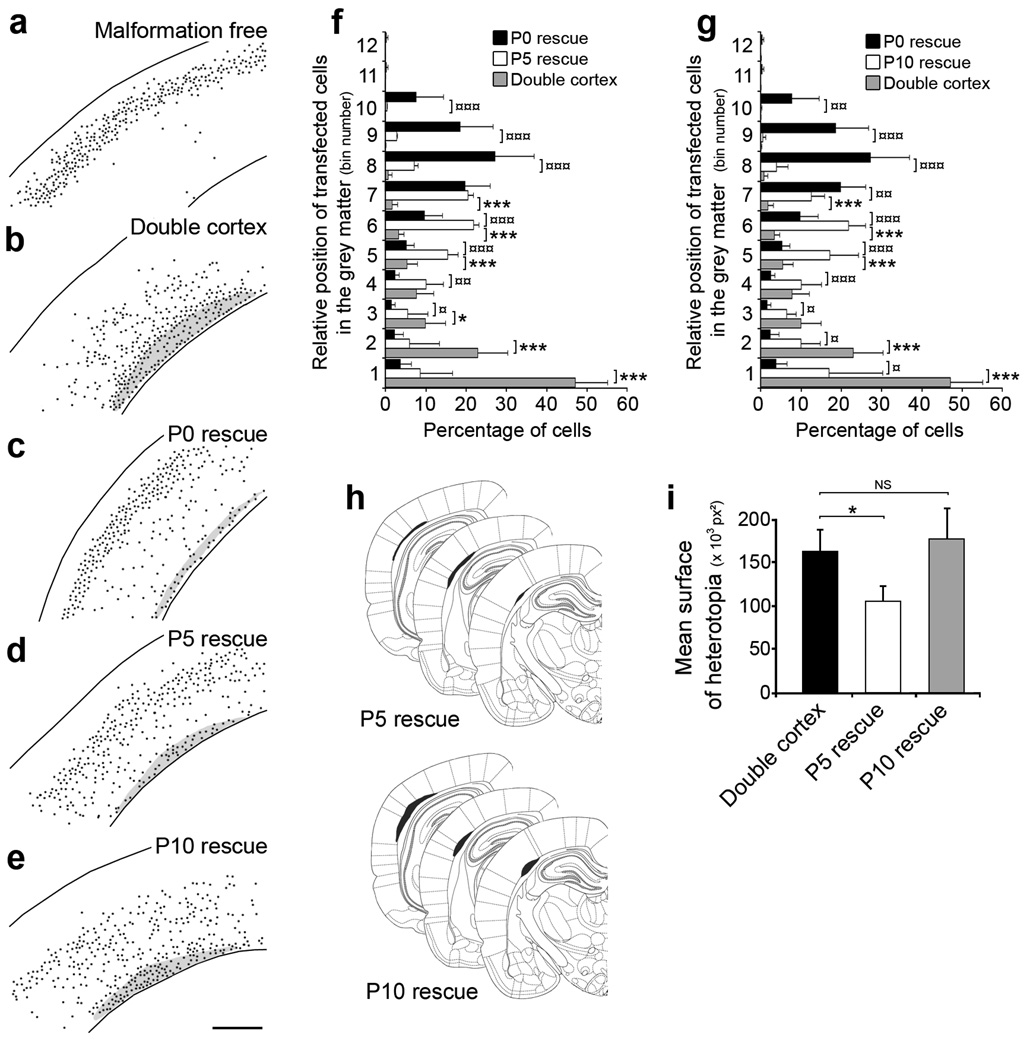
Figure 5. Critical developmental period for regressing malformation.
(a–e) Representative reconstructed neocortical sections showing the laminar position of neurons at P20 after induction of eGFP (a, b) or DCX-eGFP expression at P0 (a–c), P5 (d) and P10 (e). Black dots represent positions of transfected cells. 4 plasmids were electroporated at E14: CAG-mRFP (a–e), CAG-ERT2CreERT2 (a–e), CALNL-eGFP (a, b) or CALNL-DCX-eGFP (c–e), and 3UTRhp (c–e) or 3UTRm3hp (a), and 4-OHT was administered at P0 (a–c), P5 (d) and P10 (e).
(f, g) Quantification of transfected cells distribution within the neocortical grey matter after induction of eGFP or DCX-eGFP expression at P5 (f) and P10 (g), compared to Dcx re-expression at P0 (8–12 sections from 2–3 animals per condition). (h) Size and position of SBH at 3 rostro-caudal levels after induction of Dcx expression at P5 (top) and P10 (bottom).
(i) Quantification of SBH surface after induction of Dcx expression at P5 and P10 (8 sections from 2–3 animals per condition).
*** P < 0.001, ** P < 0.01, * P < 0.05. Scale bar, 500 µm.

