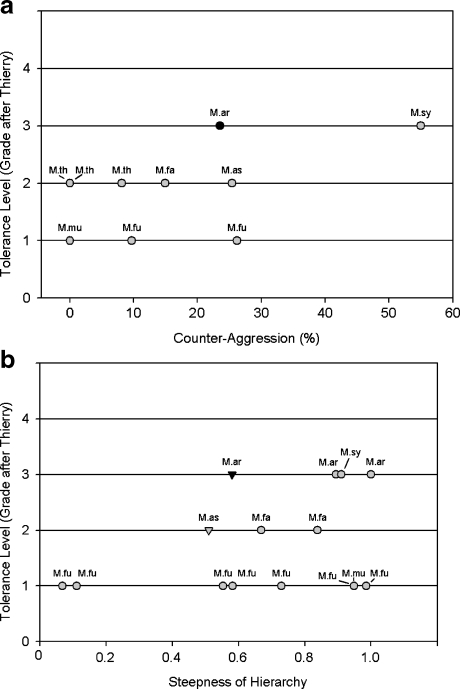
Fig. 5.
Tolerance level (grades after Thierry 2007b) in relation to (a) percentage of counteraggression for male-male dyads of different macaque species and (b) steepness of hierarchy (calculated via the Normalized David Scores) of male (triangles) or female (dots) macaques. M.ar = Macaca arctoides; M.as = Macaca assamensis; M.fa = Macaca fascicularis; M.fu = Macaca fuscata; M.mu = Macaca mulatta; M.sy = Macaca sylvanus; M.th = Macaca thibetana. Sources from left to right and bottom to top: (a) CA = counteraggression at the group level, except values marked with *, which represent mean values: M.mu (Thierry 1985): 0% CA, 4 ♂; M.fu (Thierry 1990): 9.7% CA, 7 ♂; M.fu (Petit et al.1997): 26.2% CA, 7 ♂; M.th (Berman et al.2004): period II and III 0% CA, 8 ♂; period I 8.1% CA, 7 ♂; M.fa (Thierry 1985): 14.9% CA, 4 ♂; M.as (Cooper and Bernstein 2008): 25.4% CA*, 11 ♂; M.ar (this study): 23.5% CA*, at the group level it would be 18.84% CA, 9 ♂; M.sy (Marengo, unpub. data from Thierry and Aureli 2006): 55% CA* (estimated from graphic), 24 ♂. (b) *Indicates that the steepness was calculated by Schino and Aureli (2008): M.fu (Ventura et al.2006): 0.07* for Kw group, 20 ♀; M.fu (Ventura 1988): 0.11*, 22 ♀; M.fu (Aureli, unpub.; Arnhem): 0.55*, 9 ♀; M.fu (Oi 1988): 0.58* for Hanyama-M, 10 ♀; M. fu (Ventura et al.2006): 0.73* for Nina-A group, 8 ♀; M.fu (Aureli unpub.; Artis): 0.95*, 6 ♀; M. mu (Sade 1972): 0.95*, 9 ♀; M.fu (Mehlman and Chapais 1988): 0.99*, 6 ♀; M.as (Ostner et al.2008): 0.51, 12 ♂; M.fa (Butovskaya et al.1995): 0.67* for L group, 9 ♀; M.fa (Butovskaya et al.1995): 0.84* for H group, 7 ♀; M.ar (this study): 0.58, 9 ♂; M.ar (Rhine 1972): 0.89*, 4 ♀; M.sy (Fa 1985): 0.91*, 4 ♀; M.ar (Estrada et al.1977): 1.00*, 5 ♀.

