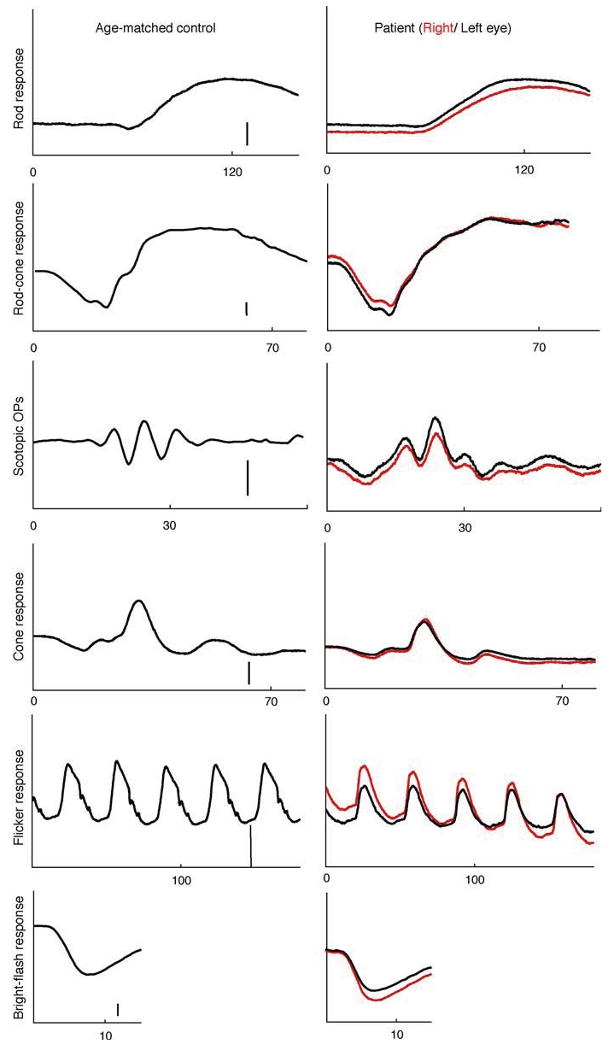
Fig. 3.

Full-field electroretinogram of the patient's right (red traces) and left eye (black traces) and an age-matched control (amplitude scale bar: 100 μV except OPs: 50 μV). The patient's rod and rod-cone b-wave responses are delayed in both eyes. (Table 1)
