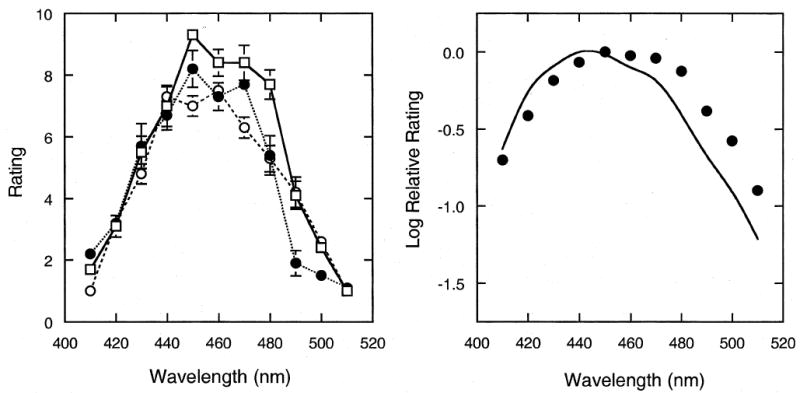
Fig. 1.

Rating of the perceived strength or salience of the foveal blue-scotoma as a function of the wavelength of a temporally 1 Hz square-wave modulated, monochromatic field adjusted to equal brightness. The left panel shows the results for individual observers. Error bars denote ± 1 standard error of the mean. The right panel shows the results averaged over three observers, plotted in terms of log relative ratings and compared to the relative spectral sensitivity function of the short-wavelength cones.
