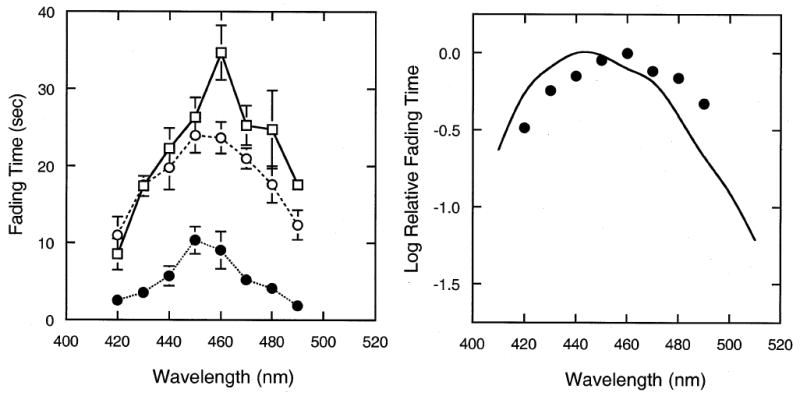
Fig. 2.

Perceptual fading of the foveal blue scotoma. The time required for the foveal blue-scotoma to fade is plotted as a function of the wavelength of a monochromatic field, square-wave modulated at 2 Hz. Left panel shows the results for individual observers. Error bars denote ± 1 standard error of the mean. The right panel shows the results averaged over observers and plotted as log relative fading time; curve as in Fig. 1.
