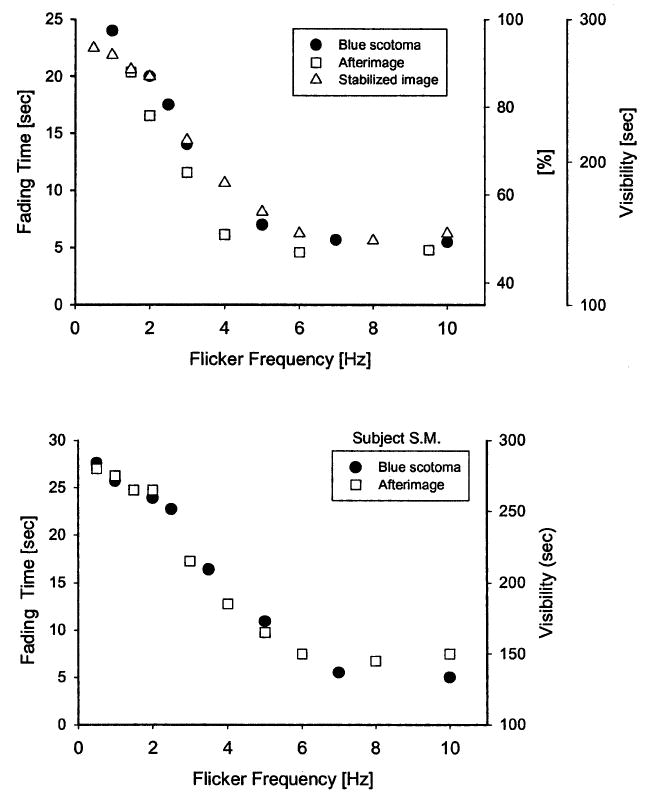
Fig. 3.

Comparison of fading characteristics of the foveal blue scotoma, optically stabilized images and visual afterimages. In the upper panel, filled symbols and left ordinate represent the time-to-fade for the foveal blue scotoma as a function of the frequency of luminance modulation of a monochromatic (450 nm) field. The means of three observers are based on 10 measurements at each frequency. Open squares and right ordinate (labeled ‘sec’) show the visibility of a flash-induced foveal afterimage, replotted from Magnussen and Torjussen (1974, fig. 1). Means of two observers. Open triangles and right ordinate (labeled ‘%’) show the visibility of the stabilized image of a foveally viewed line stimulus, based on data reported by Fiorentini and Ercoles (1960, tables 7 and 8). The lower panel shows afterimage and blue scotoma results for observer SM, who served in both experiments.
