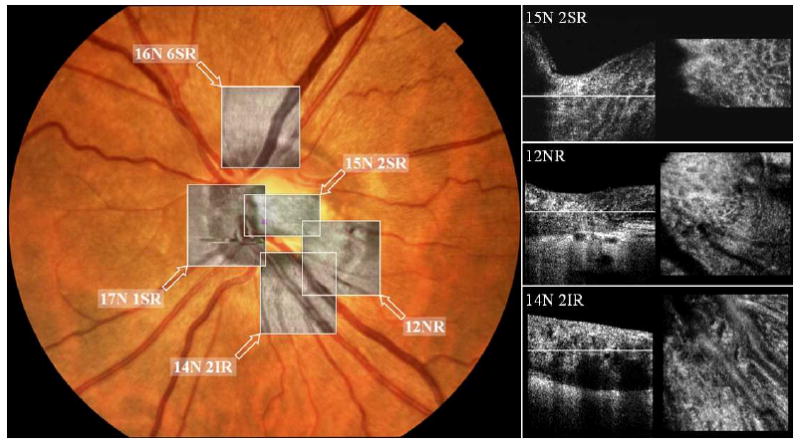
Fig. 8.

Visualization of the ONH microscopic structures imaged with AO-OCT. Left, screenshot from our custom volume renderer after co-registration of five 3D AO-OCT datasets with fundus photo. Right, screenshots from movies showing B-scan and cross-sectional view [26] of three AO-OCT volumes shown on the left: 15N 2SR (Media 2), 12NR (Media 3), and 14N 2IR (Media 4). White lines on the B-scans correspond to the depth of the C-scans reconstructed from the same volume. Multiple microscopic structures including lamina cribosa and blood vessels are easily recognizable. All the volumes can be accessed and viewed with OSA ISP: 12NR (View 4), 14N 2IR (View 5), 15N 2SR (View 6), 17N 1SR (View 7), and 16N 6SR (View 8). Note that the volume acquired at 17N 1SR has motion distortion that could not be properly corrected.
