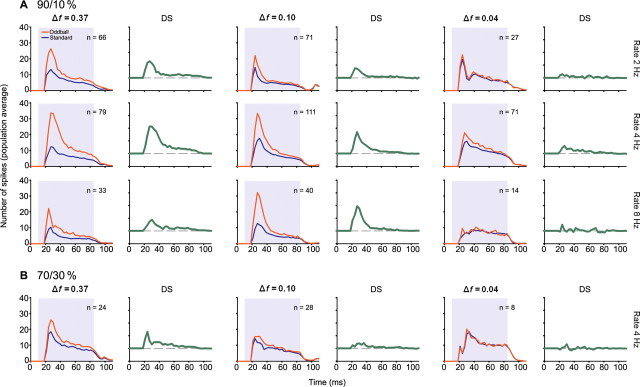
Figure 4.
A, B, Average effect of stimulus probability (A, 90/10%; B, 70/30%), frequency contrast (columns) and stimulus repetition rate (rows) across the population of IC neurons The peristimulus histograms (PSTH) for the standard and oddball stimuli were normalized to 100 trials to account for the different probabilities and averaged across the entire sample of neurons recorded from the IC. The number of neurons for each condition is indicated on each panel. The corresponding DS (difference signal) shown to the right of each PSTH represents the difference between the population response to the oddball and standard stimuli. DS is larger for larger frequency contrasts, and lower oddball probabilities. It reaches a plateau at a stimulus repetition rate equal to or larger than 4 Hz.

