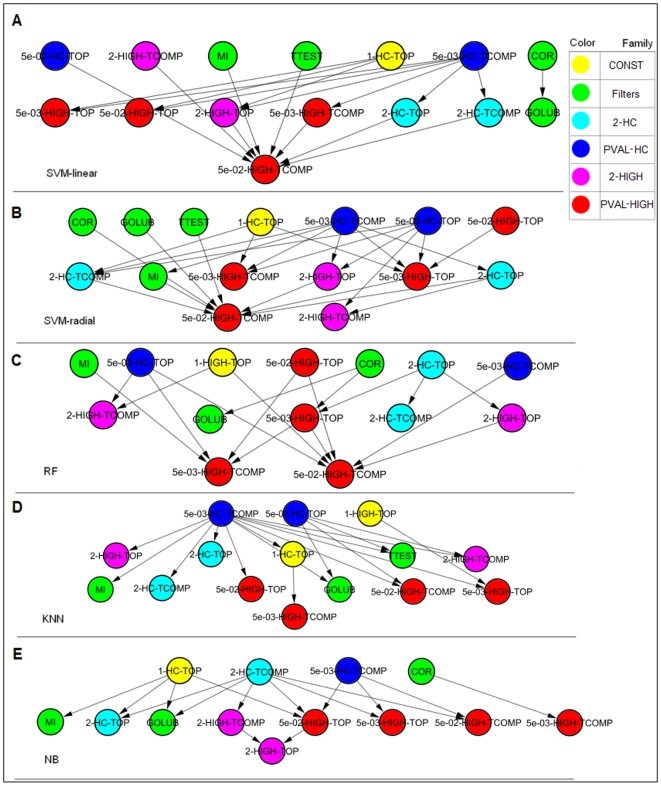
Figure 6. Dominance maps for comparing feature selectors.
The comparison is done separately for each classifier: (A) SVM-linear (B) SVM-radial (C) Random Forest (D) KNN (E) Naïve Bayes. An edge X→Y indicates that X significantly outperformed Y. In (D) the second and the third layers from the top were originally one layer that was divided into two rows for display purposes only. Methods in upper layers performed better than methods in lower ones.

