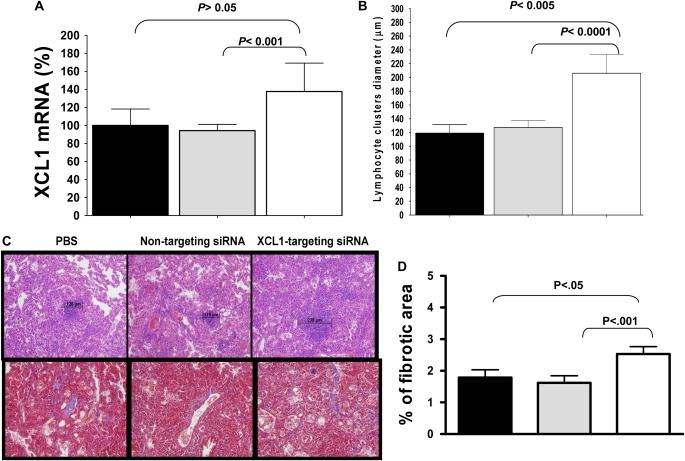
Figure 6.
Lower levels of expression of pulmonary XCL1 had a long-term effect in the lung immunopathology. (A) Percentage of xcl1 transcripts at 180 d after therapy in PBS (closed bars), non targeting siRNA (gray bars) or XCL1 targeting siRNA (open bars) treated mice. Mice that received XCL1-targeting siRNA had increased by 45% the levels of xcl1 gene transcripts by 180 d after treatment. (B) Representative images of lymphocytic foci from each group. Bar indicates the size (μm) of lymphocytes foci in each sample. Images were taken using an Olympus BX41 microscope and DP70 camera. All images were obtained using a 10× objective. (C) For each group (n = 5), 25 randomly selected images (upper panels) of lymphocyte foci in H&E stained lung sections were measured in each group. Data represent the average (±SEM) of lymphocyte foci diameter for mice treated with PBS, nontargeting siRNA, or XCL1-targeting siRNA. The lower panels in (C) correspond to fibrosis determined by Masson's trichrome staining. (D) Quantitative image analysis of fibrosis using Masson's trichrome staining. The extent of fibrosis was quantified by Masson's trichrome staining and computer-assisted image analysis, as previously reported (18, 19). Positive blue signal in 25 images from each group, indicating collagen, was selected based on its color range, and the proportional area in each image was quantified using the histogram tool and expressed as a percentage of the image. Fibrosis in mice treated with XCL1-targeting siRNA was slightly higher than in control mice. Data are expressed as the mean (±SEM) values (n = 25). The data have been analyzed using Student's two-tailed t test for paired samples. P values less than 0.05 were considered significant.

