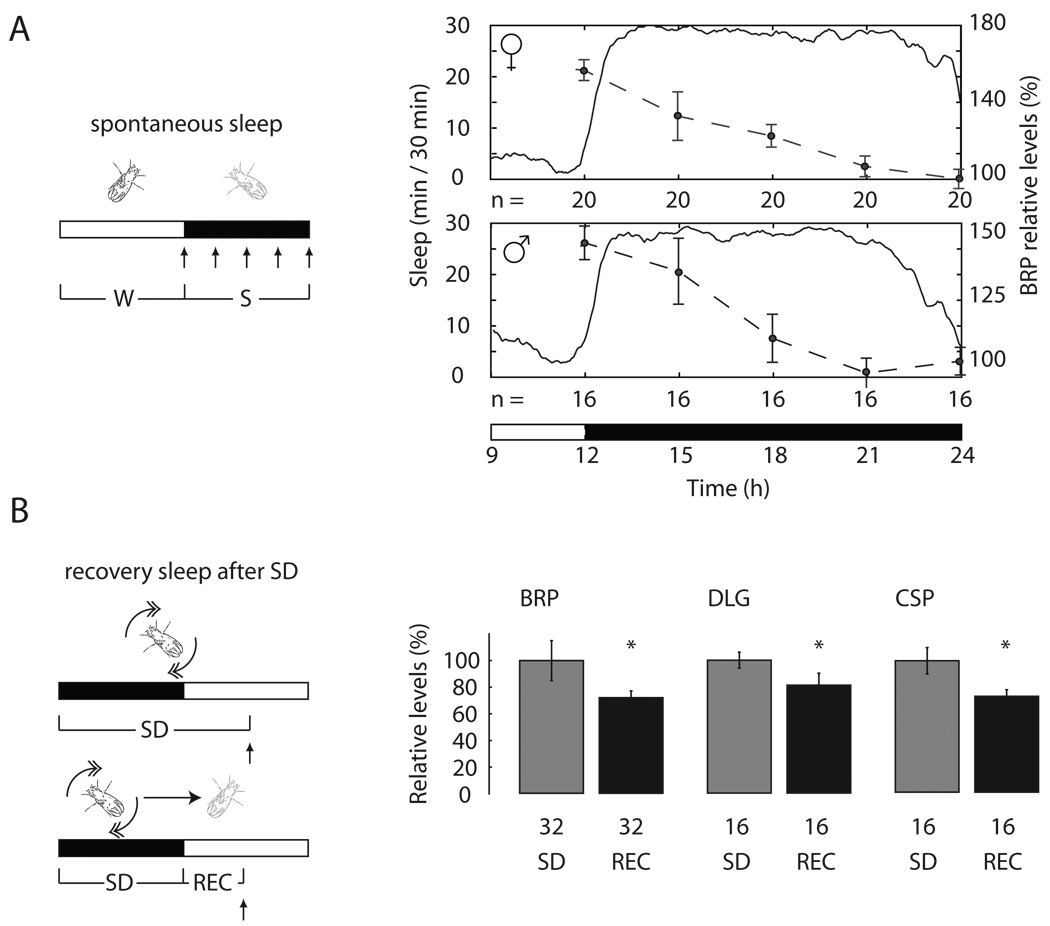
Fig. 3. Synaptic markers decrease during sleep.
(A–B, left) Rec, recovery sleep after SD. Vertical arrows show when flies were collected. (A, right) BRP levels expressed as % change relative to sleep at the end of the night (= 100%). (B, right) Levels of synaptic proteins after recovery sleep, expressed as % change relative to SD (=100%; mean ± standard deviation; n of flies is below each bar). *, p < 0.05 (Student's t-test).

