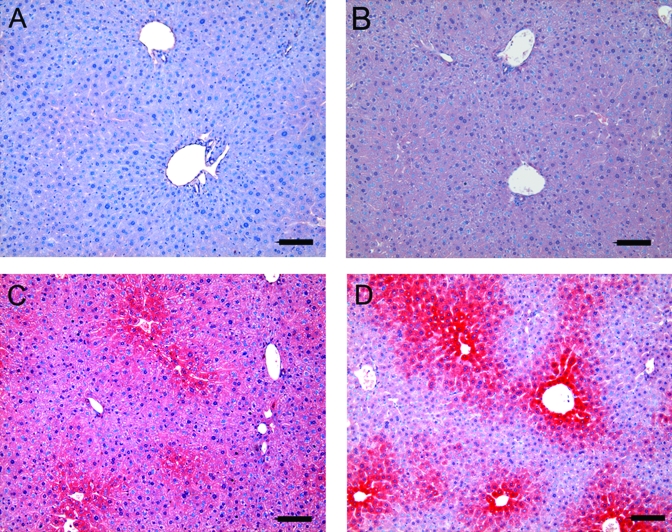
Figure 2.
Representative images of immunohistochemistry for hepatic expression of CYP1A1 protein (red). (A) Negative control (omission of primary antibody). (B) Control animal (no exposure to TCDD or cotton balls). (C) Animal exposed to cotton balls. (D) Animal exposed to TCDD. Panels C and D both show a characteristic centrilobular pattern of CYP1A1 expression. Scale bar, 20 μm.

