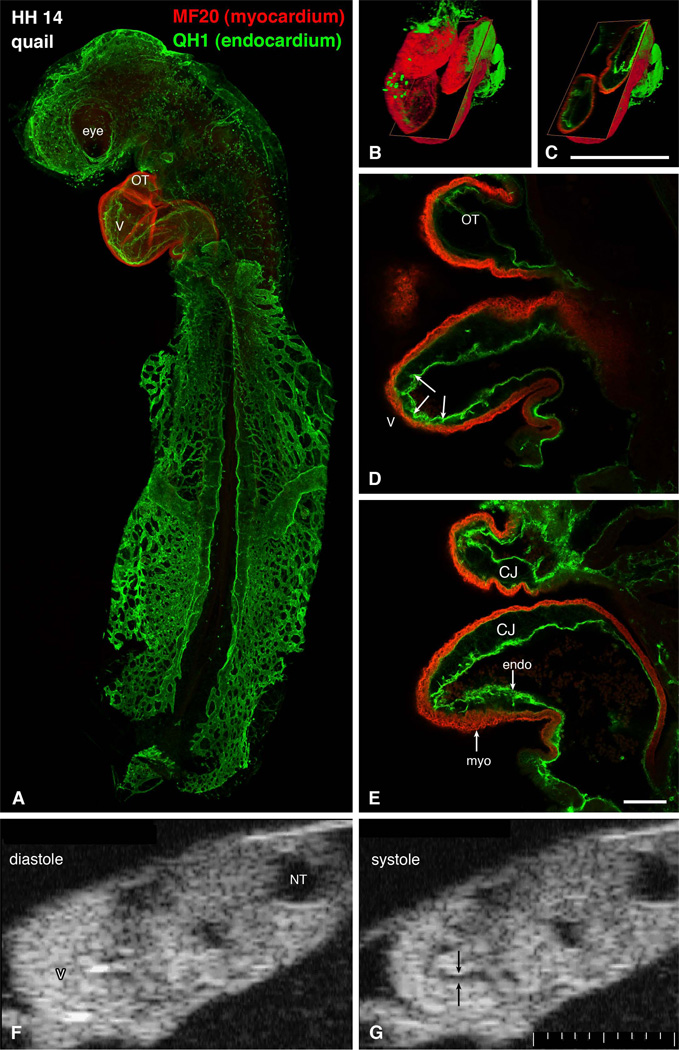
Figure 1.
Structure of a tubular heart. A-E: whole mount immunostaining for myocardial marker myosin heavy chain (red) and endothelial QH1 marker (green) shows beautifully the shape of the heart (S-loop). Individual confocal sections (D, E) show the diminished amount of cardiac jelly in the ventricular apex, resulting in close contact between these two layers. Endocardial ruffles (arrowheads) show the site of prospective trabecular formation. Three-dimensional reconstructions (B, C) show the whole heart and an oblique section illustrating the variable extent of the cardiac jelly. Scale bars 500 µm (B, C) and 100 µm (D, E). Echocardiographic views (F, G) show the heart loop in two different phases of cardiac cycle. Note the echo-free acellular layer of cardiac jelly (arrows) along the inner curvature during systole. CJ, cardiac jelly, endo, endocardium, myo, myocardium, NT, neural tube, OT, outflow tract, V, ventricle. Scale bar 100 µm smallest division.

