
Fig. 5. E7 augments E6-induced hTERT transcription and telomerase activity.
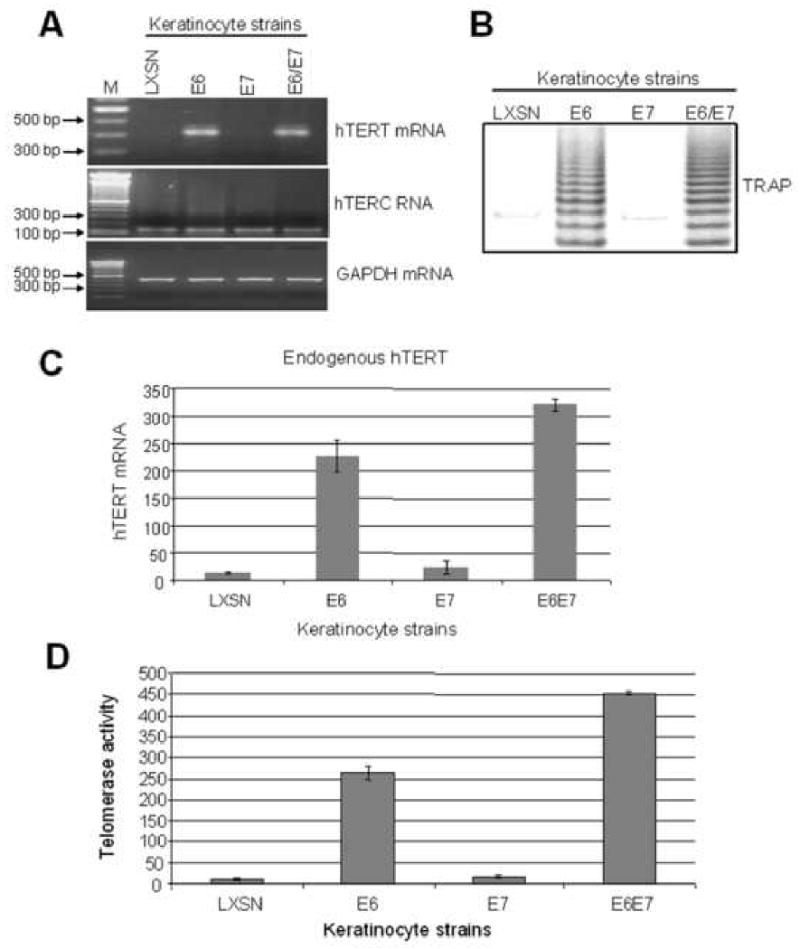
(A) hTERT and hTERC mRNA expression in stable keratinocyte cell lines. hTERT mRNA and hTERC RNA were detected with sets of the primers described in Materials and Methods. Detectable hTERT mRNA was observed only in cells expressing the E6 gene. hTERC RNA was expressed constitutively in all cell strains. (B) Telomerase activity. A qualitative TRAP assay was performed as described in Materials and Methods. A typical DNA ladder (6-base pair difference per band) was generated by cellular telomerase in the cell extract of keratinocytes transduced with the E6 or E6E7 genes. (C) Quantitative RT-PCR detection of hTERT mRNA. A real time quantitative RT-PCR was performed to quantify hTERT mRNA levels shown in panel A. These quantitative data demonstrated reproducible, higher hTERT mRNA levels in E6/E7 expressing cells than in E6 expressing cells. (D) Quantitative TRAP detection of telomerase activity. A quantitative-TRAP assay (Materials and Methods) was also performed to quantify the changes observed in panel B. The E6/E7 cells showed higher telomerase activity than E6 cells, correlating with the hTERT mRNA levels shown in panel C.