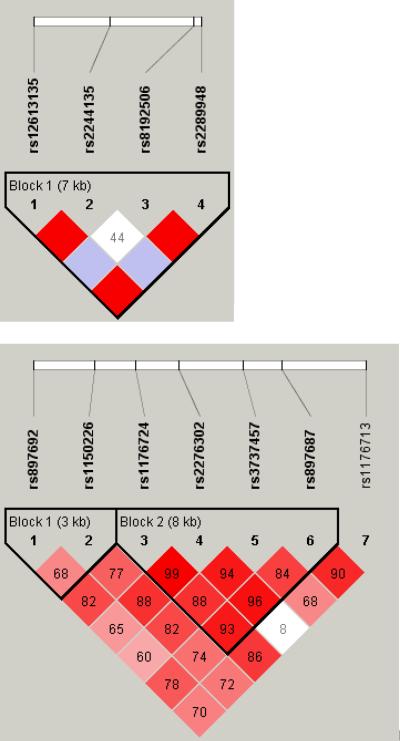
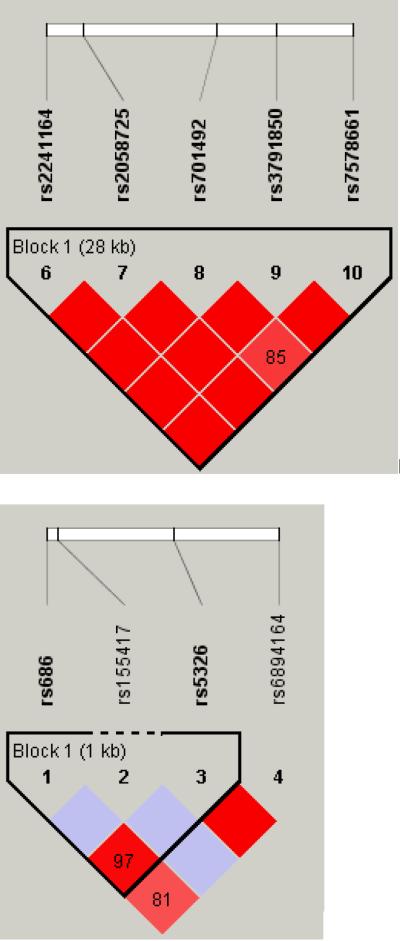
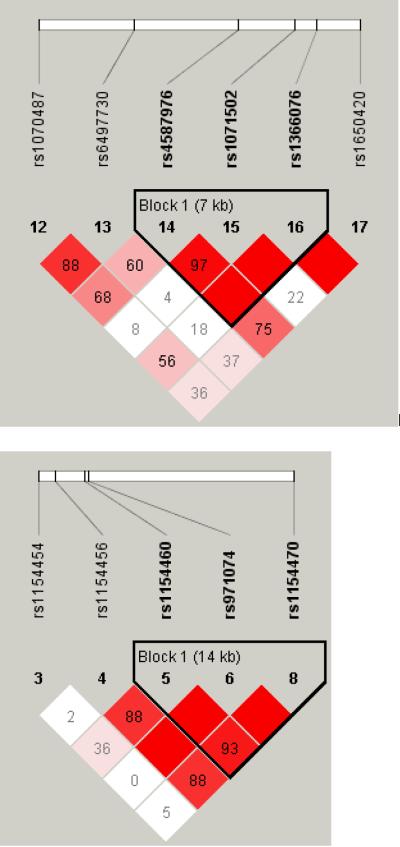
Figure 1.
LD maps of six genes in AA controls.
The pair-wise correlation between SNPs was measured as D' and is shown (×100) in each box. The color scheme indicates the magnitude of D'. Dark red indicated D'>0.80 with D'=1.0 when no number is given. Haplotypes were generated using block definitions of the solid spine of LD (a-b) and Gabriel (c-f), and haplotype blocks are marked. (a) DBI (b) HTR3A (c) GAD1 (d) DRD1 (e) GRIN2A (f) ADH7.


