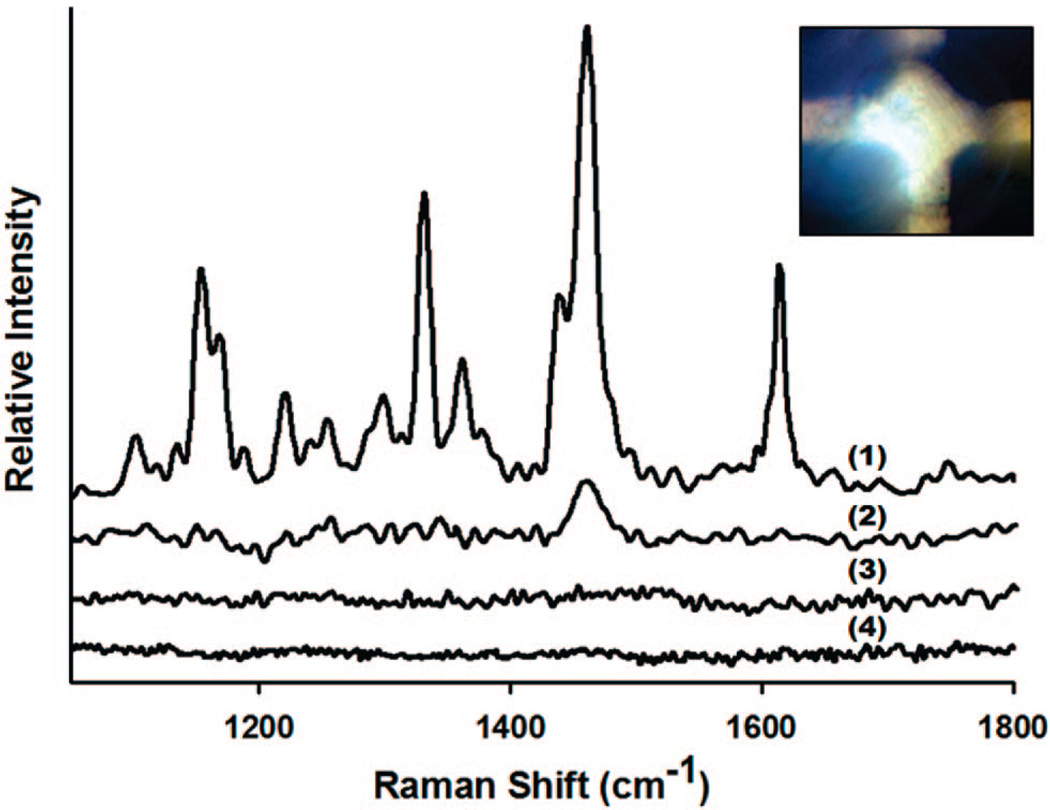
Figure 4.
SERS spectra collected on-chip for (a) positive sample containing FMdT-labeled LDR-SERS products by the mutant template (denoted as FMdT-labeled MT), (b) negative sample reacted by WT, (c) control sample containing silver particles and DNA, and (d) background control sample containing silver particles and linker. The concentration of each SNP is 100 pM.

