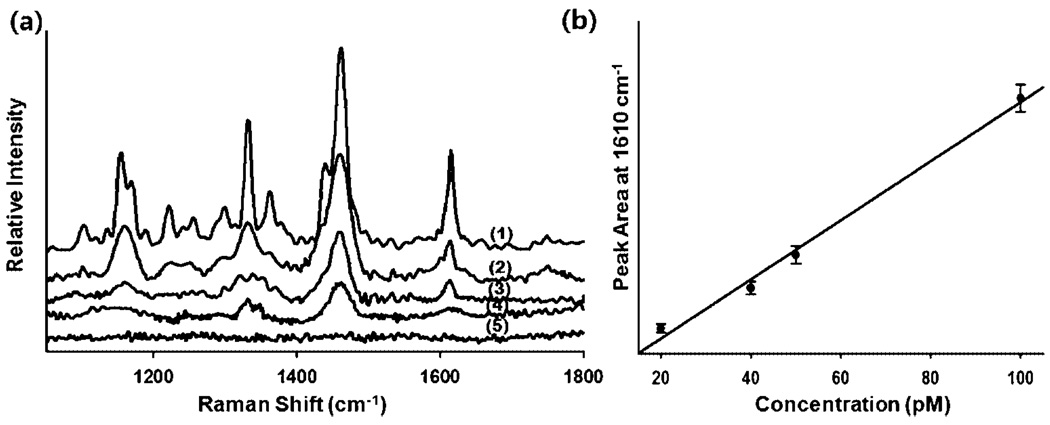
Figure 5.
(a) SERS spectra of FMdT-labeled MT in a microwell with the different concentrations of LDR-SERS products. (1) 100, (2) 50, (3) 40, (4) 20, and (5) 10 pM LDR-SERS samples. (b) Plot of peak area at 1610 cm−1 as a function of concentration (R = 0.993). Note that the 10 pM result is omitted from (b) since the concentration was below the limit of detection.

